INSYDOR user guide
Learn how to read listing, AI review, and category insights for Takealot product decisions.
Now available
Listing analytics
Sales trends, volume and quantity, estimated daily sales, first review date
AI review insights
Pros, cons, hot topics, use cases, and recommendations
Category analytics
Category trends, volume and quantity, peak and lowest months
Before you start
- INSYDOR extension installed
- Sign in to keep your plan and usage in sync
- Browsing a Takealot product or category page
Listing analytics
Understand a single listing’s performance and lifecycle. Sales trends, volume and quantity, first review date, months since listing, and estimated daily sales help you decide whether to follow or stock.
Steps
Open a product page
Open any Takealot product detail page.
Find the INSYDOR panel
The panel appears on the page; open the “Listing analysis” tab.
Refresh data
For a first-time analysis, click refresh to fetch the latest data.
Read the results
After a few seconds you’ll see the sales trend chart and key data.
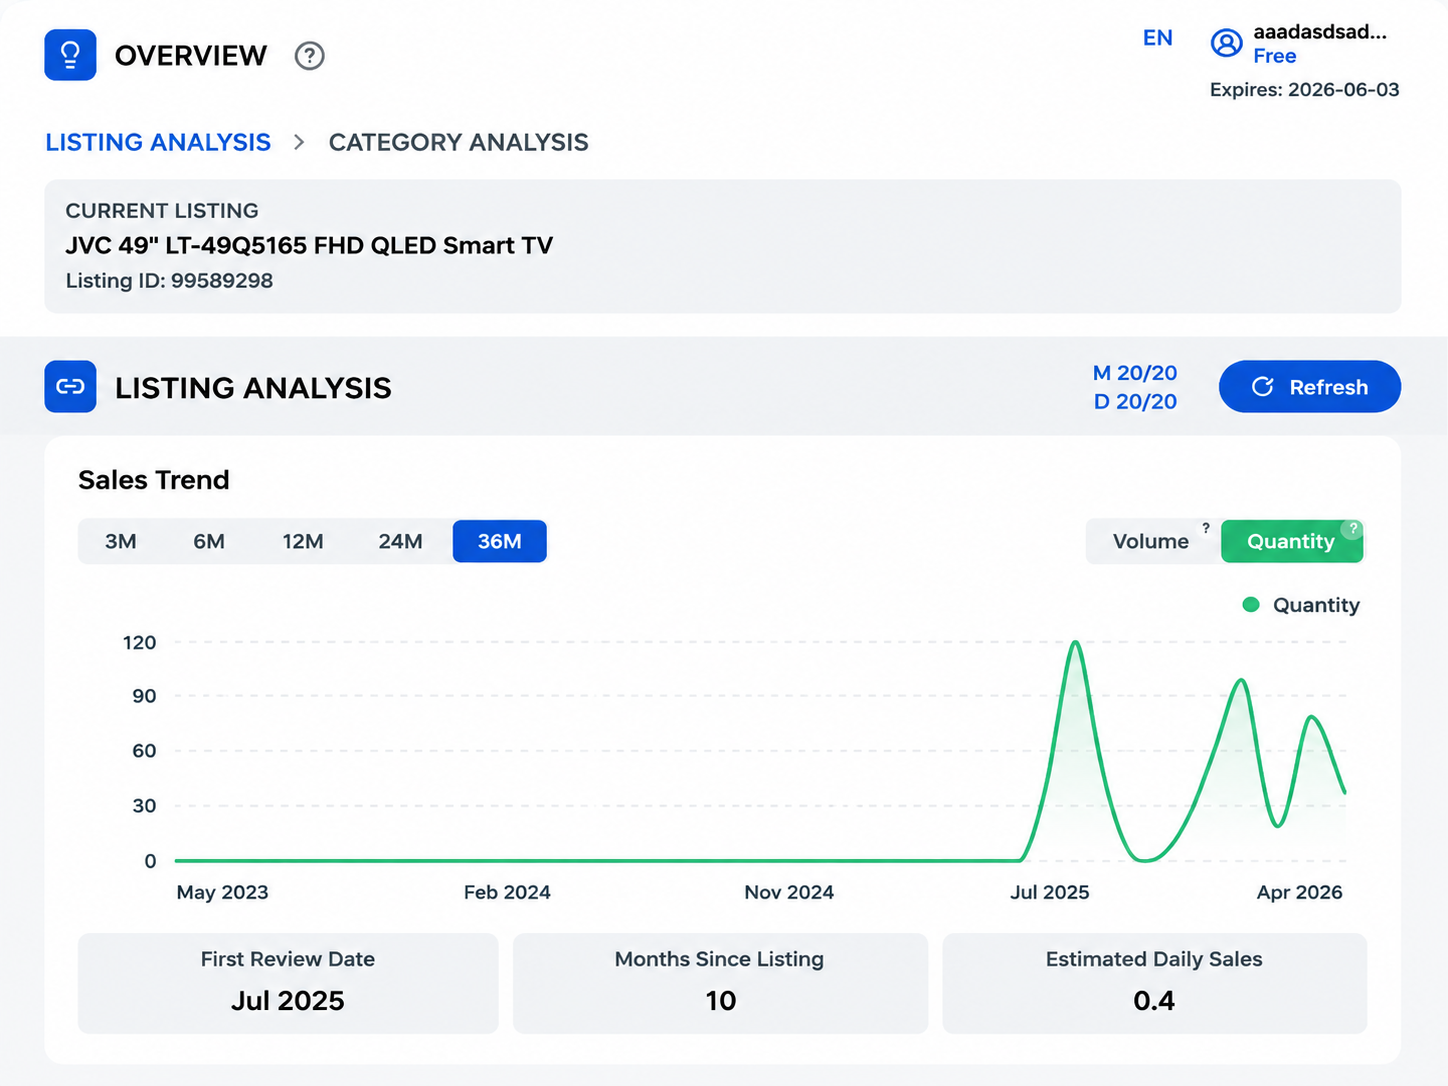
Reading the output
Sales trend
Check 3–36 months of quantity or volume changes to see whether demand is growing, stable, or declining.
First review date
Use the first review date as a signal for when the product first became active.
Months since listing
See how long the product has been selling, so you can tell if a listing is new, growing, or mature.
Estimated daily sales
Use recent sales signals to estimate how many units the product may sell each day.
FAQ
AI review insights
Use AI to summarize customer reviews into pros, cons, hot topics, use cases, and recommendations for your product page.
Steps
Pick a product with reviews
Products with more reviews usually give clearer results.
Open the AI reviews tab
In the INSYDOR panel, choose the AI reviews tab.
Generate the analysis
Click refresh. AI analyzes the reviews and shows the results, usually in 40–60 seconds.
Read the results
You’ll see pros, cons, hot topics, use cases, and recommendations.
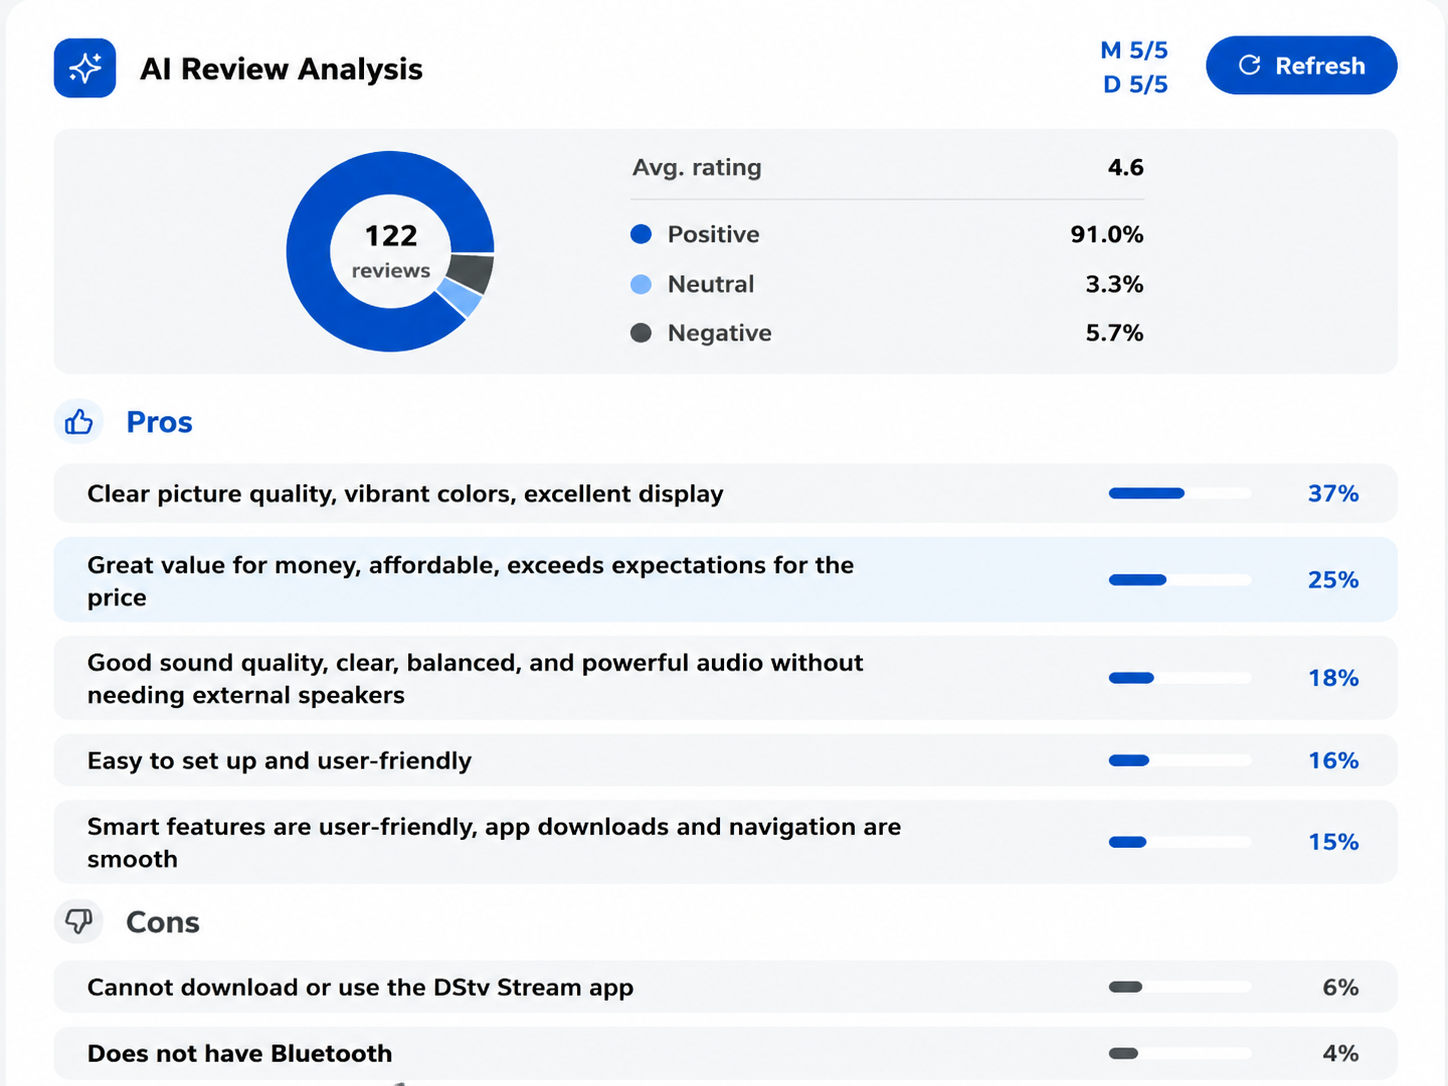
Reading the output
Pros
See what buyers like and which selling points may matter.
Cons
Find repeated complaints that may signal quality or return risk.
Hot topics
Find the topics buyers mention most often.
Use cases
See how buyers use the product and what they care about.
Recommendations
Use review feedback to improve the product page or the product itself.
FAQ
Category analytics
Use category trends, price bands, and top sellers, brands, and listings to understand the market.
Steps
Open a category page
Navigate to any Takealot category listing (e.g. Baby > Car seats).
Open the category tab
In the INSYDOR panel, choose category analytics.
Refresh
Get the latest category data for the page you are on.
Read the results
Check the category trend, price bands, and top rankings.
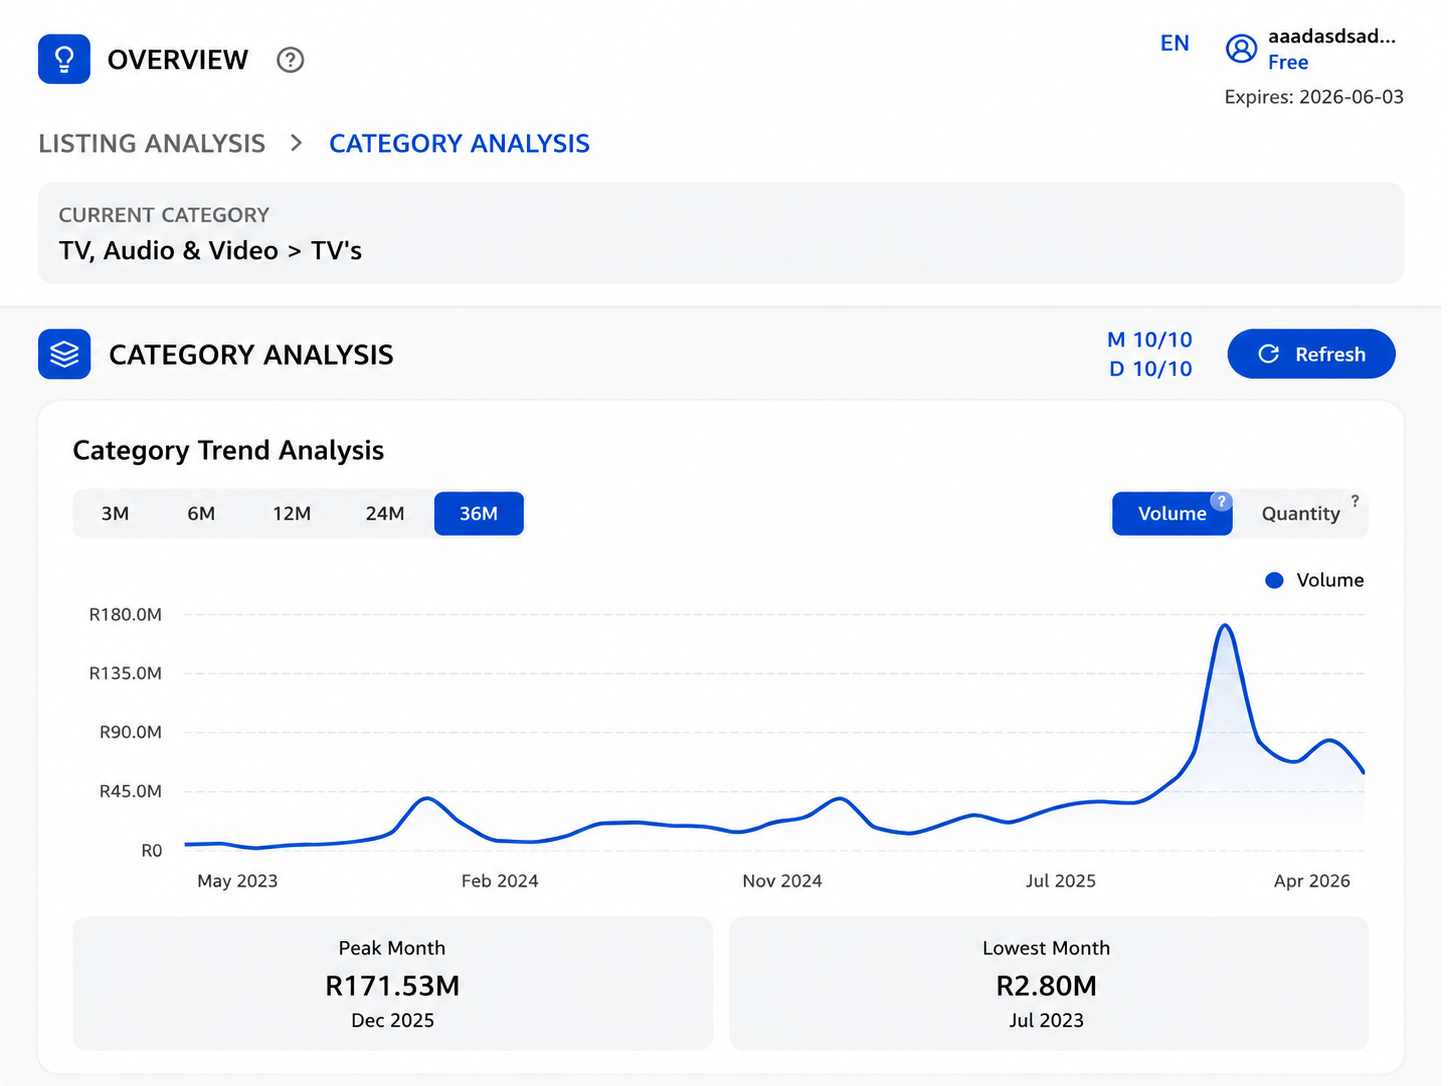
Reading the output
Category trend
Check whether demand is growing, stable, or declining by volume or quantity.
Price bands
See which price ranges have the most listings and where competition may be higher.
Top rankings
See the leading sellers, brands, and listings in the category.
Peak and lowest months
Spot high and low demand months for stocking and promotion planning.
FAQ
Seller analytics (coming later)
Coming later: analyze top sellers by sales, trends, share, and product focus to understand what works.
Expected coverage
- Seller sales trends and stability
- Category share and core listings
- Risk signals and follow-sell hints
Brand analytics (coming later)
Coming later: compare top brands by sales, trends, share, and positioning to identify market opportunities.
Expected coverage
- Brand share and growth within a category
- Core price windows and positioning
- Top-listing contribution and opportunity niches
Still need help?
We will help with setup, usage, or billing questions.
support@insydor.com